
At the Audience Insights Department at Babcox Media, we do a lot of survey research projects. Some of them are for our content team, such as our annual PARTS survey or Tire Review’s Rolling with the Numbers feature, and some are proprietary studies for our advertisers.
No matter what kind of study, a common question is, “How many responses should we have to our survey?” The answer to that question is difficult because it is a trade-off. The more respondents you have to your survey, the more accurate it is. However, the more respondents you have to the survey, the more expensive it will be. Let’s look at this trade-off.
Let’s start with a look at accuracy. When we do a survey, we are only talking to a fraction of the total population we are interested in, such as all automotive technicians or all independent repair facilities. When we get results from the survey, such as “50% of automotive service technicians say vanilla is their favorite ice cream flavor,” that answer is an approximation. The true answer is probably within a margin of error of that 50% number.
The size of that margin of error can be calculated by a well-known statistical formula. I won’t repeat that formula here and trigger unwanted flashbacks to long-ago algebra or statistics classes. But in layman’s terms, the most important input to the formula is the number of respondents, or what statisticians refer to as the sample size. There are some other factors involved, but here we will only concentrate on what happens when we change the number of respondents.
The chart below shows the margin of error, in percentage terms, for different sized surveys. The most important thing to realize is that our results are non-linear – they aren’t in a straight line. If we had a survey of 50 respondents, we would have a margin of error of almost 14%. That’s not very precise! On our ice cream example above, all we could say that the percentage of technicians who pick vanilla would be somewhere between 36% and 64%. If we added 50 more respondents, the margin of error would drop by about 4%. That is a nice gain in precision for the additional 50 respondents. Now we would say that our margin is between 40% and 60%.
If we had a survey of 200, our margin of error would be under 7%. (In our ice cream example, that means the answer is somewhere between 43% and 57%). But adding another 50 respondents only drops the margin of error by less than a full percentage point. And as you can see from the chart, each time we add 50 more respondents, the gain in our margin of error gets even smaller.
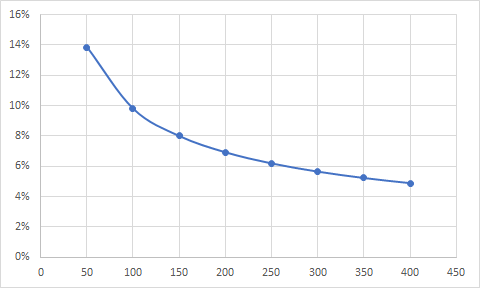
Margin of error declines as you add respondents, but at a decreasing rate.
Since research firms base their charges on the number of respondents, you can see that accuracy, as measured by a decline in the margin of error, has a price. That’s why we often suggest a survey size of approximately 200 responses, as a reasonable trade-off between accuracy and cost.
Any questions? Don’t worry, there won’t be a quiz. But give me a call or send me an email if you want to see how this could relate to your research needs.
Creative Best Practices For Digital Advertising – Vehicle Care Industry Edition
Interested in understanding how your brand gets the attention that it (surely) deserves when competing not only with other digital ads, but content as well? Well, you are in luck! We’ve put together this guide to outline the basics of digital advertising, primarily focused on creative suggestions to help you drive success.